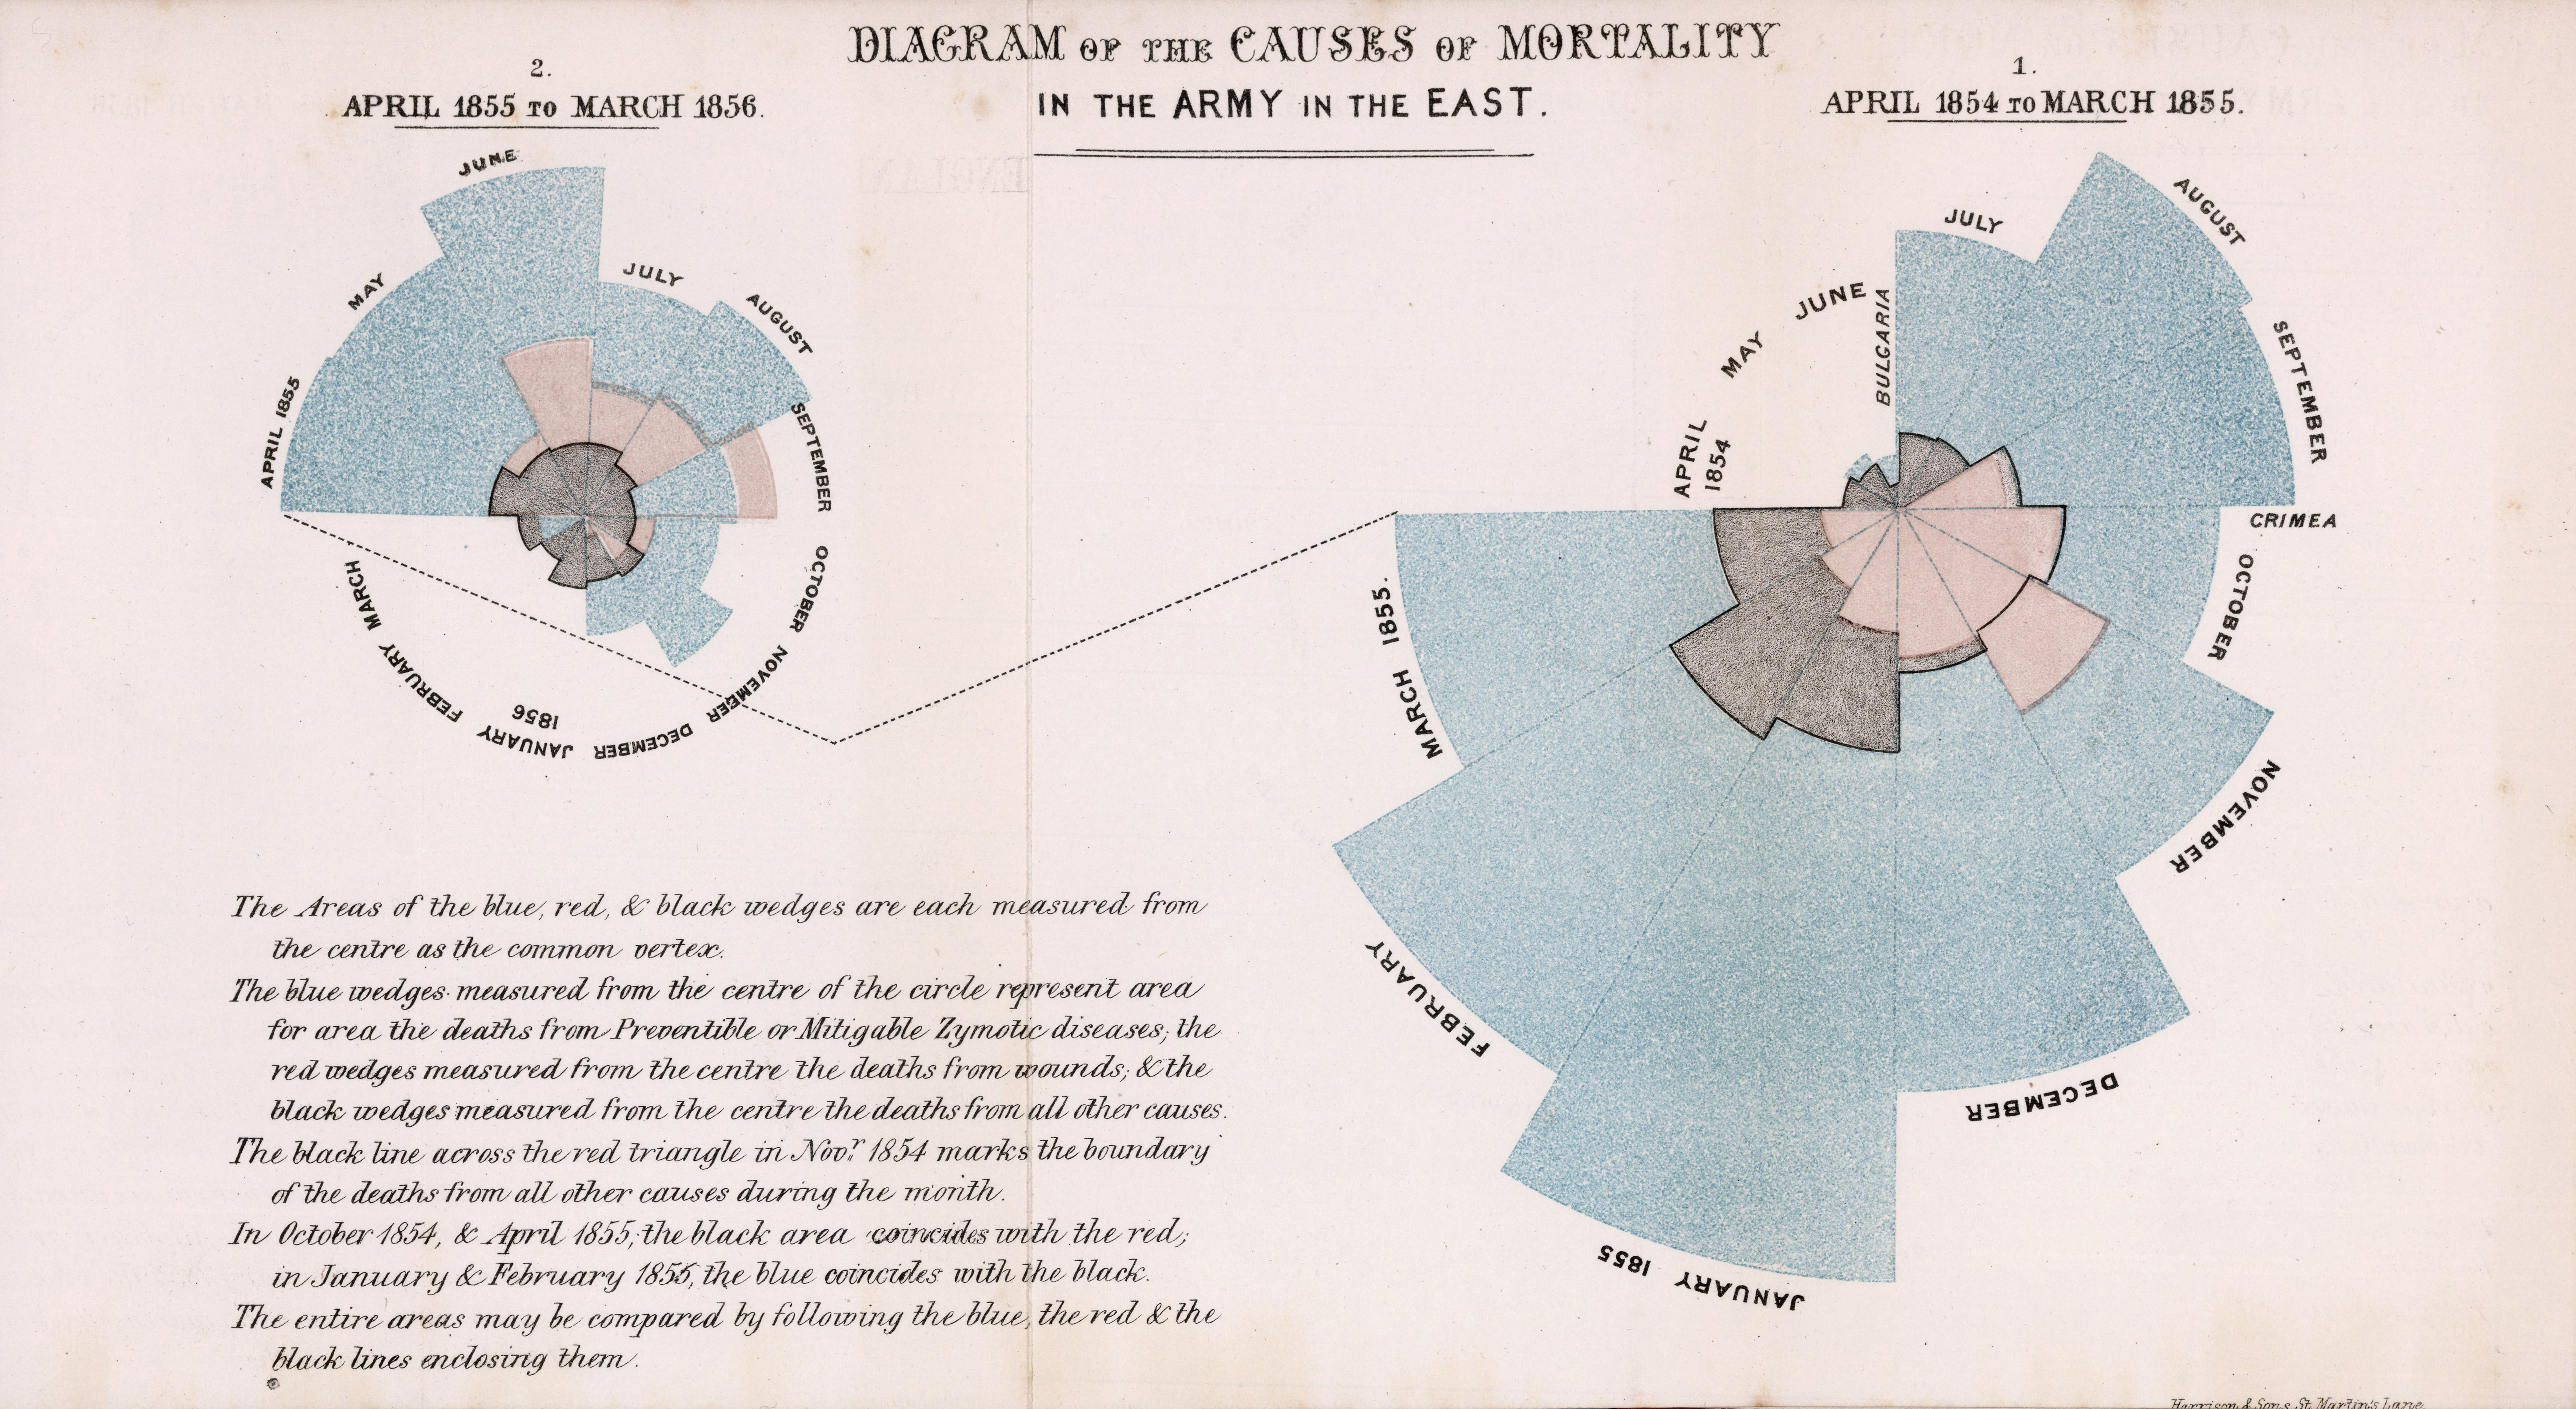
Jack Bandy 2026
This is a demo slide deck for reference and experimentation.
Testing content slide.
“The greatest value of a picture is when it forces us to notice what we never expected to see.” — John Tukey
import numpy as np
import polars as pl
stations = pl.read_csv("cta_stations.csv")
orange = stations.filter(pl.col("line") == "Orange")
by_access = orange.group_by("accessible").len(name="station_count")
share = np.round(
by_access["station_count"] / by_access["station_count"].sum(),
2,
)
print(by_access.with_columns(accessible_share=share))| Week | Focus |
|---|---|
| 0 | Setup and orientation |
| 1 | Blah blah |
| 2 | Blah blah blah |
| 3 | Blah blah blah blah |


CS 418, Intro to Data Science, Week 0dodatascience.fun/slides/week0